U.S. Vehicle Sales Rankings By Model - November 2016 YTD
U.S. SUV/Crossover Sales Rankings By Model - November 2016 YTD
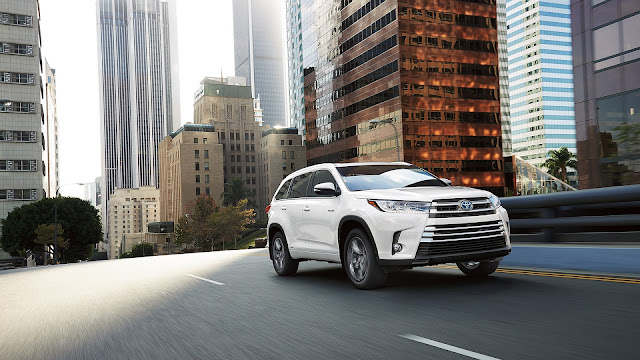
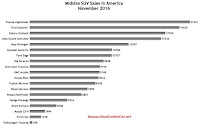
Highlander volume jumped 67% to 21,241 units as Toyota brings the refreshed 2017 model to market. That's 3422 more sales than the Honda Pilot, Nissan Pathfinder, and Mazda CX-9 combined.
 |
| Click Chart To Expand |
And sales of the Pathfinder and CX-9, compatriots of the Highlander that the Toyota so roundly trounced, grew by 1707 and 792 units, respectively. Even the Ford Flex was on the rise. Indeed, Flex sales are up 10% so far this year. 2016 is already the best year of U.S. Flex sales since 2012.
You can click any model name in the tables below to find historical monthly and yearly U.S. auto sales data. You can also select a make and model at GCBC's Sales Stats page. These tables are sortable, so you can rank midsize SUVs and crossovers any which way you like. Mobile users can now thumb across the tables for full-width access. Suggestions on how GCBC should break down segments can be passed on through the Contact page.
Click Column Headers To Sort • October 2016 • November 2015
SUV | Nov. 2016 | Nov. 2015 | % Change | 2016 YTD | 2015 YTD | % Change |
|---|---|---|---|---|---|---|
3508 | 4658 | -24.7% | 48,228 | 56,145 | -14.1% | |
9194 | 8684 | 5.9% | 106,320 | 110,802 | -4.0% | |
4934 | 5644 | -12.6% | 62,678 | 56,897 | 10.2% | |
10,757 | 8137 | 32.2% | 121,897 | 113,857 | 7.1% | |
19,628 | 16,690 | 17.6% | 226,650 | 227,584 | -0.4% | |
1478 | 1364 | 8.4% | 19,578 | 17,835 | 9.8% | |
9168 | 6776 | 35.3% | 76,277 | 89,127 | -14.4% | |
9024 | 10,975 | -17.8% | 108,700 | 122,868 | -11.5% | |
10,786 | 9156 | 17.8% | 120,395 | 108,616 | 10.8% | |
17,230 | 17,662 | -2.4% | 86,107 | 64,188 | 34.1% | |
9698 | 9023 | 7.5% | 102,951 | 103,377 | -0.4% | |
1994 | 1202 | 65.9% | 13,457 | 16,846 | -20.1% | |
7589 | 5574 | 36.2% | 79,072 | 55,824 | 41.6% | |
6801 | 5094 | 33.5% | 72,333 | 73,675 | -1.8% | |
8628 | 7583 | 13.8% | 100,463 | 87,081 | 15.4% | |
21,241 | 12,741 | 66.7% | 165,954 | 142,817 | 16.2% | |
348 | 397 | -12.3% | 3827 | 6551 | -41.6% | |
--- | --- | --- | --- | --- | --- | --- |
Total | 152,006 | 131,360 | 15.7% | 1,514,887 | 1,454,090 | 4.2% |
Offroaders | Nov. 2016 | Nov. 2015 | % Change | 2016 YTD | 2015 YTD | % Change |
|---|---|---|---|---|---|---|
12,957 | 13,948 | -7.1% | 176,053 | 186,835 | -5.8% | |
--- | 169 | -100% | 38 | 10,602 | -99.6% | |
1 | 1 | 0.0% | 9 | 226 | -96.0% | |
--- | --- | --- | --- | --- | --- | --- |
Total | 12,958 | 14,118 | -8.2% | 176,100 | 197,663 | -10.9% |
Tall Wagons & Crossovers | Nov. 2016 | Nov. 2015 | % Change | 2016 YTD | 2015 YTD | % Change |
|---|---|---|---|---|---|---|
--- | 527 | -100% | 726 | 8491 | -91.5% | |
17,769 | 13,079 | 35.9% | 162,203 | 136,227 | 19.1% | |
4 | 602 | -99.3% | 588 | 20,950 | -97.2% | |
--- | --- | --- | --- | --- | --- | --- |
Total | 17,773 | 14,208 | 25.1% | 163,517 | 165,668 | -1.3% |
GCBC isn't here to break down segments, an impossible task for any group, but to display sales data for the sake of comparison. The more ways sales data can be displayed, the better. This explains why you'll see the Outback and Venza here but also with midsize cars, too, and the pricey FJ Cruiser and Xterra with smaller utilities and the Volkswagen Touareg with luxury SUVs... because readers have wanted it both ways. You can always find the sales results for EVERY vehicle and form your own competitive sets by using the All Vehicle Rankings posts.
RECOMMENDED READING
Midsize SUV Sales In America - October 2016
Midsize SUV Sales In America - November 2015
Top 20 Best-Selling SUVs In America - November 2016
U.S. Auto Sales Brand Rankings - November 2016
Large SUV Sales In America - November 2016
Small SUV Sales In America - November 2016

0 Komentar untuk "Midsize SUV Sales In America - November 2016 YTD"