U.S. Vehicle Sales Rankings By Model - November 2016 YTD
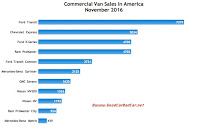
The Ford Transit, for the first time in its U.S. sales history, posted a year-over-year loss. That 23% drop, combined with the smaller Transit Connect's 36% decline, caused total Ford van sales to fall 17%. GM commercial van sales, likewise across three nameplates, fell 9%.
 |
| Click Chart To Expand |
Nissan's NV and NV200 were both on the rise in November, as they are this year.
Ram's largest ProMaster more than doubled its volume, year-over-year, but the smaller ProMaster City saw its volume chopped in half.
You can click any model name in the tables below to find historical monthly and yearly U.S. auto sales data. You can also select a make and model at GCBC's Sales Stats page. This table is sortable, so you can rank commercial vans any which way you like. Mobile users can now thumb across the table for full-width access. Suggestions on how GCBC should break down segments can be passed on through the Contact page.
Click Column Headers To Sort • October 2016 • November 2015
Van | Nov. 2016 | Nov. 2015 | % Change | 2016 YTD | 2015 YTD | % Change |
|---|---|---|---|---|---|---|
254 | 833 | -69.5% | 6290 | 9195 | -31.6% | |
5034 | 5371 | -6.3% | 60,244 | 56,021 | 7.5% | |
4705 | 3994 | 17.8% | 49,492 | 47,066 | 5.2% | |
7379 | 9584 | -23.0% | 130,188 | 105,030 | 24.0% | |
2721 | 4237 | -35.8% | 38,739 | 46,941 | -17.5% | |
1635 | 1439 | 13.6% | 16,291 | 19,211 | -15.2% | |
439 | 515 | -14.8% | 5151 | 515 | 900% | |
2125 | 2255 | -5.8% | 25,293 | 23,073 | 0.4% | |
1193 | 1105 | 8.0% | 15,936 | 15,034 | 6.0% | |
1363 | 1193 | 14.2% | 16,985 | 15,536 | 9.3% | |
--- | 2 | -100% | 21 | 2157 | -99.0% | |
4702 | 2084 | 126% | 35,746 | 23,658 | 51.1% | |
924 | 1721 | -46.3% | 14,625 | 8015 | 82.5% | |
--- | --- | --- | --- | --- | --- | --- |
Full-Size Commercial Vans ³ | 26,773 | 25,832 | 3.6% | 333,190 | 289,093 | 15.3% |
Small Commercial Vans ² | 5701 | 8501 | -32.9% | 81,811 | 82,359 | -0.7% |
--- | --- | --- | --- | --- | --- | --- |
Total | 32,474 | 34,333 | -5.4% | 415,001 | 371,452 | 11.7% |
RECOMMENDED READING
Commercial Van Sales In America - October 2016
Commercial Van Sales In America - November 2015
U.S. Auto Sales Brand Rankings - November 2016
Top 11 Best-Selling Trucks In America - November 2016
Minivan Sales In America - November 2016

0 Komentar untuk "Commercial Van Sales In America - November 2016 YTD"